Advertising

Live quote Ticker

Showing posts with label article. Show all posts

Tuesday, September 27, 2016

rhein

TIPS, Setup Price Action On Some Market Conditions

As discussed in some of the previous articles, the price action can be applied to a variety of market conditions provided that the formation of the bar that is formed is pretty valid. A valid bar formation is supported by momentum trend (bullish/bearish), key levels (support/resistance) and also moving average as an indicator of the dynamic level to confirm the strength of a trend of form.

This article discusses examples of the application of price action on market conditions some of the currency and the commodity gold (XAU/USD), how do we identify the formation of bar and timings for entry. From the few examples it can be seen that the formation of the price action could always formed on the price movement of several currencies and other commodities, not only on currency pairs or only certain commodities, also in different market conditions (trending and ranging/sideway)

not all of the application of price action always went smoothly, there were also indications that failed though quite valid, but in an important us forex trading must always be based on risk management to determine the stop loss and profit target in accordance with trading plan that we agree upon.

1. Examples on the EUR/USD: pin bar and counter trend


On the chart of the EUR/USD 4-hour formed a valid pin bar on August 6, 2010. We note the daily chartnya, level 1.3333 is a level where a strong key support level has been previously compromised and now so resistance level tested (arrow to the left of the 3 on the daily cahrt above). Well, on the 4-hour chart is tested again by the pin bar formed, apparently not translucent or experiencing rejection (rejecting). After the pin bar finished the next bar and also formed under this key level, then we can decide to sell at a level around 50% of the length of the bar pin. Although the previous price movements rising trend, but with the formation of price action that is valid on the key level which indicates impending counter trend (with the resistance level by rejecting the pin bar formed), we can take a position based on a sell signal that enough valid it is.

2. Example on AUD/JPY: inside bar/pin bar on conditions ranging (sideway)


The chart above AUD/JPY daily market conditions being sideway with resistance level at around 77.60 and support about 73.62. In August 2010 is formed inside the bar and bar/pin combinations inside the bar. As discussed in the previous topic, price action formation inside the bar indicates the market is this group, and in this case the forwarding happens trend (downtrend) after the next bar is formed. If we miss the moment, entry on on 23 August be formation inside the bar with a combination of pin bars that support the forwarding of the previous trend, and this is the sell signal which is quite valid for our open positions with the reward level (target) at level supportnya.

3. Example on AUD/USD: fakey bar, counter trend and pin bar
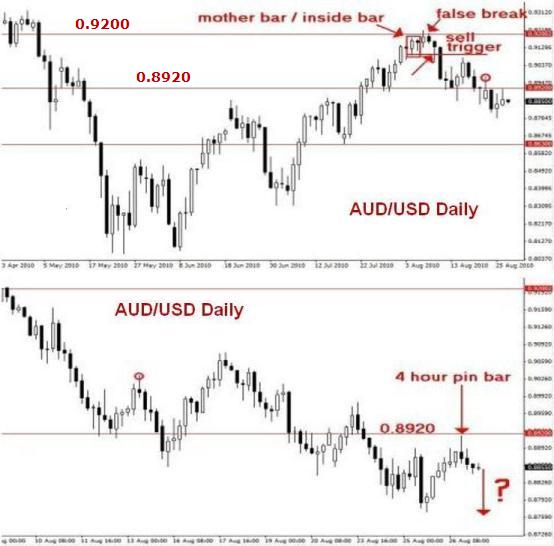
 

Similar to the previous example 1, price action on AUD/USD above also confirm the counter trend that will occur with the formation of fakey bar once inside the bar. Fakey rejecting bar at 0.9200 resistance level gave a sell signal with the target level on support at 0.8920.

Then on the 4-hour chart formed a pin bar unconfirmed clearly on the daily chart. If our assumptions on a 4-hour course, and rejecting the pin bar at 0.8920 support level, we could sell entry with reward (target) level that is not too large because of unconfirmed right with higher time frame (daily chart).

4. Example: NZD/USD pin bar that runs good and fail


In the example above there are 2 pin bar. The first (top) go according to the rules of price action after rejecting on its resistance level. Stop loss can be at a level slightly above the highest level pin bar, and if left open positions can still be entry level corrections bars 4-6 the next day during resistance level has not been impregnable.

The second pin bar (below) that is formed is an example of an indication of the price action that failed. If we open buy on the day afterwards with stop loss at the level of the lowest level under little pin bar, maybe the losses we are not too large.

Indeed not all lineups bar formed in the price action always goes well, that we still have to take care of is the risk/reward ratio in accordance with our plan. trading

5. Examples on the USD/CAD: pin bar that runs good and fail on ranging market


As with example 4, pin bar last (rightmost) on ranging USD/CAD daily chart above has failed to indicate a buy signal, at least if the stop loss level we are slightly below the lowest level the bar pin
 
6. Examples on the XAU/USD (Gold): pin bar that runs good and fail on ranging market 


The price action in gold (XAU/USD) at the time of the period such as the image above indicates the signals a valid trading supported by key resistance level in 1, 210.00. After rejecting occurred inside the bar on the level of the key we can sell with stop entry levels above the highest level inside the bar. Our buy position open after closing prices the day after the fakey setups candlestick bar broke through a key level, and we can average with a buy entry again after rejecting the pin bar (far right) at level a key support level now so

. If we see the price movements in the days that followed, the formations are formed inside the bar (lower picture) that allows forwarding trend up, and with the momentum bullish signal indicates a fairly strong buy


In conclusion, the formation of price action always happens almost every week on the price movement of several currencies and other commodities. Some of them are there really is less valid even fail to indicate signal trades. The more we often observed with careful analysis on a wide range of currencies and commodities will be the more accurate we determine the formation of a valid bar

Because not all lineups bar formed in the price action has always run smoothly, we should keep trading in accordance with the risk/reward ratio that we agree upon.
Read More

Saturday, September 24, 2016

rhein

Inspiration Forex (1) - Sun Tzu

The art of war Sun Tzu is a widely read classics and applied to various fields, because of the nature of the fundamental natural easily adapted in various areas of life. In this post, I extract some sections to be applied in trading and in doing so, hoping to introduce the concept of trading that are important to you.


I also classifies and categorizes them for easy understanding. To put it in context, I have the term outcome as follows:
-General = you/
trader-Trading
= Battle troops = capital/money You

in TERMS OF UNDERSTANDING the MARKET

"we are not fit to lead an army on the March unless we are familiar with the face of his country-the mountains and forests, traps and cliffs as well as swamps." (Sun Tzu).

Like what Warren Buffett puts it, "the risk of not knowing what you are doing. If you do not understand the market, you are not fit to invest in it. You will get your capital (soldiers) were swept out of stock "

" he who knows all this, and in fighting puts his knowledge into practice, will win the battle. " (Sun Tzu).

Not good enough if we only know the theories and concepts behind the investment. A trader should be able to apply that knowledge correctly to gain profit from the market.

In TERMS of PSYCHOLOGY TRADER

"a general, who was unable to control his annoyance, will launch his men to attack like ants swarming, resulted in one third of his men fall, while the city was still uncontrollably. Such is the ill effects of the siege. " (Sun Tzu)

Don't be emotionally affected by market or loss. If a trader is too eager to profit or revenge losses, traders can lose sanity and become irrational. Decisions that diabil likely to defect and ended up with a loss. Such is the ill effects of impulsive
trading
"there are five dangerous faults which may affect a General:
(1) faux pas, that leads to destruction,
(2) coward, which leads to being caught,
(3) hasty temperament, which can be triggered by humiliation,
(4) the enjoyment of honor which is sensitive to shame,
(5) over-attention on the troops, who took him on concerns and issues"

Psychology is the key to the trader. If he can't control his emotions and his character, he will lose money in the market. If he's sloppy, he will make a desperate trading without taking into account the opportunities to win. If he is a coward, he never could win big enough to cover the losses. If he has a temperament that is hasty, he will try to take revenge on the market that ended with losses. If she prides itself on when he wins, he will be calm when he lost and he'll never learn from mistakes. If he is over attention on the loss, he would always worry and can never make deals more with better.

In TERMS of MANAGEMENT of MONEY

"control/settings over a large army is the same principle as control over some people, it is just sebuahpertanyaan about the Division of their numbers." (Sun Tzu)

Trading big capital is the same is the case with small capital trading. You should not be affected by the absolute figures of losses and gains when trading. Follow the normal rules and system and divide the capital accord of the lot and the right position.

In TERMS of MOVING AWAY FROM MARKET

"he will win who knows when to fight and when not to fight." (Sun Tzu)

Opportunities are not always available in the market. There are times that your trading system would not work and it is important to be absent from the trading market. If you insist in the trading market in conditions like that, you'll end up in a series of losses and deplete your capital unnecessarily.

When you experience a series of losses, it is a sign of clear for you to stop trading. Contemplate whether it is a problem with myself, or a system that does not work under certain market conditions.

During live your reflection, stop all your trading activities until you find out the real problem. You will learn more about yourself, trading systems and market. This experience will help in assessing when to trade and when not to trade in the future. Do not fight not meaningless coward, it is the mantra of "survive to fight another day."

"If the battle is sure to produce a victory, then you must fight, even though rulers had forbidden it. If fighting will not result in victory, then you don't have to fight even when there is a supply of rulers. "

Important learning to trading when there is a favorable opportunity to do so. But more importantly learning not to trading when the situation is not favorable.
Read More
rhein

the KEY to confirm price action

This article discusses about some way of confirming setup price action formed in order to obtained a valid trading signals. Konfirmator commonly used is a level-level support and resistance, both in the form of a horizontal line as well as in the form of moving averages. Price action formation creations can be directly observed in chart trading, so too are the levels of the intended konfirmator. With the combination of price action and the level of support or resistance will be obtained with trading signals a high enough probability.

The stronger level of support or resistance the more valid trading signals are generated. Price action formed at approximately the level shows market sentiment is going on. To avoid any noise or errors that might happen we can use the time frame height (4-hour or daily), is to determine the proper entry momentum could use technical indicators as indicators of oscillator overbought level for knowing or oversold (RSI, stochastic, MACD), and indicator ADX trend strength to know is going on.

Confirmation of the price action on the conditions of the market trending

the following example setup price action that occurs on the level of support and resistance levels for the downtrend market conditions (the main trend) and corrections (the retracement).


Note the formation of bar formed at level-the level of support and resistance (a horizontal red line) that we can use to nenetapkan entry level after the formation of the bar is formed, and also the exit level of the target. Some pin bar formed experiencing rejection (rejection) by the level of resistance or support, and long tail bar pin formed close to a new support level.

Confirmation of the price action on the market condition sideways (ranging)

In a sideways market conditions (ranging), konfirmator is best to be on the level of support and resistance. This kind of market conditions can be seen through the indicator ADX and oscillator where the trend is happening is not strong enough.


It appears that the formation of the bar formed at the level of support and resistance (inside the bar and pin bar) is quite valid as signal entry. It's just for the market that is being consolidated like this we should be careful in determining the exit target must anticipate if the direction of price movement suddenly turned and turned into a trending. This is where the importance of the risk/reward ratio in the trading plan. When the support level has been impregnable with long tail pin bar formation, then the next two days the price fell sharply and market conditions become a downtrend. At the time it was formed and the pin bar support level to break down the actual conditions, ranging above is finished and changed into a downtrend.

Confirmation of the price action with moving averages as support and resistance Indicator

dynamic exponential moving average (ema) mainly ema8-daily ema21-daily and is often used as a confirmation of the price action that is occurring, especially in a trending market conditions. EMA forms a level-level of support or resistance.

In the example above setup price action which occurred near ema8-daily ema21 and daily-i.e. the pin bar and fakey bar can be used as a signal for the entry.
Read More
rhein

4 things About Price Action that needs to be Known

The State of the market is always changing over time, so too his volatility. A when the market price fluctuations can be very high with a large daily trading range, but at other times the market can barely moving quietly for a certain period of time. When volatility is low many traders who complained did nothing wrong with the price action. Even though they are trading with observed price action but may be less savvy about the price action itself. There is no wrong or right on price action, price action is only reflecting market reaction over the sentiment of the perpetrators.

1. Price action trading systems is not a
many traders consider the price action is a trading system that is rigid and should be run in accordance with certain rules. Price action is not a trading system that implements many technical indicators, but more into discretionary trading is more based on the experience and not too rely on technical indicators. So far there has been no trading software programmed based on price action.

In trading with observations of price action is not necessary calculations such as technical indicators but rather observations on market movements which change according to the sentiment of the market participants. Most professional traders use discretionary trading, which is certainly not escape the observation on price action.

2. Price action is universal and can always run
Most traders there who complained as "this time the method of price action is not running" or "maybe there is something wrong with the price his action". Trading based on observations of the price action has been used in Japan since the 18th century in order to predict price movement of rice along with starting the introduction of how to read market price movement with the candlestick. At that time there has not been one indikatorpun used, and up to now, 300 years later, candlestick and observations of price action is still used in trading

. Trading with price action is how to read candlestick patterns are natural, and this can always be applied as the sentiment of market participants will tend to repeat them are greed and fear (greedy and fear) that is always reflected in the pattern of price action.

3. Price action rather than just a row of bars
candlestick Price action is not just rows of candlestick bars with a certain formula-formula, but shows the overall market movement is driven by the sentiment of the market participants. The longer you observe market movements (or the higher time frame trading), then you will understand the market sentiment was further

. 4. the Necessary consistency and discipline to understand price action
Unlike the technical indicators which can be quickly understood, interpretation of price action takes time and experience. To understand the pattern of price movements which change according to the sentiment of the market you have to consistently practice and discipline.

Read More

Friday, September 23, 2016

rhein

TRICK & Level Key of Price Action

Level level key meant here is the level of support and resistance, both in the form of a horizontal line, static or dynamic form aluran line moving average. Fibonacci retracement level also includes key level because it shows
support and resistance. As it has never been reviewed on several articles before, trading with price action does not rely on technical indicators are complicated and complex but only on observation of the formation the formation of bar-bar at candlestick could be, fakey (false) the bar and inside the bar (the term in the price action). Supporting indicators are often used to confirm is the exponential moving average (ema), because the moving average shows the level of support/resistance

dynamic. In this article reviewed how the formation of price action formed at key levels will affect significantly to the direction of price movements, so that we can appropriately determine the points
entry. The following examples use the daily time frame, which is highly recommended for use when we are trading with price action.
method of
Price action and levels of support/resistance on trending market conditions


Note the formation of bar formed at level-the level of support and resistance (a horizontal red line) that surely we can use to nenetapkan level entry (after the formation of the bar was formed) and exit level target (line support/resistance).

Price action and levels of support/resistance on ranging market conditions (sideway)


It appears that the formation of the bar formed at the level of support and resistance (inside the bar and pin bar) is quite valid for our entry. It's just for the market that is being
or being
ranging group we should be careful in determining the exit target because we must anticipate if market conditions suddenly turned contrary to our entry positions and turned into strong trending. This is where the importance of the risk/reward ratio in trading

plan. When the support level has been impregnable with the formation of long tailed pin bar, then the next two days the price fell sharply and market conditions become a downtrend. At the time it was formed and the pin bar support level to break down the actual conditions, ranging above is finished and changed into a downtrend. We can sell entry on two the next day.

Price action and ' swing ' point on trending market conditions

When a price movement occurs at the points of the new highest or lowest, and then undergo a correction before returning to the original trend, the lowest price and the highest peak or Valley on the correction is called swing point. Swing point important to note because at those points will be established the levels of support or resistance. Swing point at that point in the Valley when the uptrend forming a new support level, and at the cusp point swing when the downtrend will form a new resistance level.

Look at the price action which occurred near at points swing point for example EUR/USD daily above. Swing point forming the level key (key level) the new support level, and confirmed the validitasnya on the bars in a row as the next resistance, support and resistance again. Price action that occurs is represented by two pin bar formed at the level of the key, and we can analyze its validity after the entry pin the bar correctly. In this case the key level is formed on the swing point becomes the second major factor supporting the bar pin .

Price action and the exponential moving average indicator on trending market conditions


An indicator of the exponential moving average (ema) mainly ema8 daily ema21 and daily is often used as a confirmation of the price action that is occurring, especially in a trending market conditions. The moving average formed a level of support or resistance. Look at the examples on the EUR/USD daily above, price action which occurred near ema8 and ema21 in trending market conditions (when an uptrend or downtrend), namely in the form of a pin bar and the bar pretty fakey valid for our entry guidelines.

Price action and event area on the level of support and resistance.
 

Event area yaitu area disekitar level support atau resistance yang tertembus (break) akibat event tertentu yang terjadi pada pergerakan harga pasar. Selanjutnya jika pergerakan harga tetap mengacu pada level support atau resistance tersebut, maka event area pada level itu akan sangat signifikan, dan price action yang terbentuk disekitarnya sangat penting untuk dicermati.
Pada contoh XAU/USD (spot gold) diatas, event area disekitar level 1,700.00 adalah sangat signifikan dimana price action yang terjadi dengan terbentuknya beberapa pin bar yang cukup valid untuk patokan entry.
Dari contoh-contoh diatas bisa disimpulkan bahwa price action yang terjadi pada suatu kondisi pasar dengan level-level kuncinya sebagai faktor pendukung utama, baik itu level support / resistance statis (garis horisontal) atau dinamis (exponential moving average), swing point ataupun event area, akan bisa menjadi pedoman yang cukup valid untuk entry market.


Read More

Thursday, September 22, 2016

rhein

Some TRICK trade with Price action


Many forex traders tend to try to analyze multiple variables at the same time, especially traders who do not yet have a specific strategy and methods to be applied in daily trading. Often they combine several technical indicators at once, see a few currency pairs in different time frames as well as the development of various news reading fundamentals. This way is clearly not effective. They intend to understand the movement of market prices with coverage that is too broad so confusing and tends to over-

analysis. This article related to the concept of ' specialisation ' in forex trading, where the method of price action is one part of it. Forex trader is a profession, and as with any other profession, specialization in General is always more profitable. Doctors commonly encountered and for the lucky income can be very good, but the more rare specialist of general practitioner course will earn better because they controlled the special fields that are not owned by general practitioners. A forex traders who have certain methods that have been tested are specialists in trading.

The advantage of the method of price action
the main advantage is price action trading method this method can be used with simple. We just need to focus on the pattern of market price movement for what it is as well as level-the level of support and resistance. Technical indicators are very minimal, usually only the moving average indicator for confirmation. The method of price action can be applied on all currency pairs and time frame trading used usually daily or 4-hour. If at one time frame have been formed within the formation setup price actionnya, then it should not be compared with the time frame larger or smaller. With the accustomed method using price action in the discipline in trading, the trader will no doubt when it was about to open a position because of the trading signals that are generated are usually quite valid.

Examples of the application of the method of price action Following the trading method is exemplified
with the price action on the EUR/JPY daily. You could develop a method of price action with your own strategy, especially in determining entry and exit points as well as risk/reward ratio. EUR/JPY is exemplified here because this currency pair is quite popular, liquid and can be predicted (predictable)
First is to determine market conditions, trending or ranging (sideways)
Having in mind the market conditions are currently uptrend, we then determine the level key support and resistance:
We use indicators of exponential moving average (ema) 8 and 21 ema as confirmation of the setup price action formed. As it known in the setup price action there is pin bars, fakey bar and inside the bar. In the chart of EUR/JPY setup fakey look of this bar by the refusal (rejection) of ema8 as a dynamic support level, and if the setup is correct (unconfirmed) price will move in the direction of the uptrend.

The main characteristics of the formation of the fakey bar consists of the inside bar, followed by a false break ' bar ' that is formed and closed at the level of the range inside the bar. The entry point for a buy position can be specified when the top level inside the bar is penetrated, being stop loss level set at a low level of formation fakey bar (the ' false break ').

Finally we set the risk/reward ratio. Can be 1:1 or 1:2 in accordance with the money management strategy which we have agreed. We can also maximize profit using trailing stop, averaging technique or pyramiding.


Read More