Advertising

Live quote Ticker

Showing posts with label article. Show all posts

Tuesday, September 27, 2016

rhein

TIPS, Setup Price Action On Some Market Conditions

As discussed in some of the previous articles, the price action can be applied to a variety of market conditions provided that the formation of the bar that is formed is pretty valid. A valid bar formation is supported by momentum trend (bullish/bearish), key levels (support/resistance) and also moving average as an indicator of the dynamic level to confirm the strength of a trend of form.

This article discusses examples of the application of price action on market conditions some of the currency and the commodity gold (XAU/USD), how do we identify the formation of bar and timings for entry. From the few examples it can be seen that the formation of the price action could always formed on the price movement of several currencies and other commodities, not only on currency pairs or only certain commodities, also in different market conditions (trending and ranging/sideway)

not all of the application of price action always went smoothly, there were also indications that failed though quite valid, but in an important us forex trading must always be based on risk management to determine the stop loss and profit target in accordance with trading plan that we agree upon.

1. Examples on the EUR/USD: pin bar and counter trend


On the chart of the EUR/USD 4-hour formed a valid pin bar on August 6, 2010. We note the daily chartnya, level 1.3333 is a level where a strong key support level has been previously compromised and now so resistance level tested (arrow to the left of the 3 on the daily cahrt above). Well, on the 4-hour chart is tested again by the pin bar formed, apparently not translucent or experiencing rejection (rejecting). After the pin bar finished the next bar and also formed under this key level, then we can decide to sell at a level around 50% of the length of the bar pin. Although the previous price movements rising trend, but with the formation of price action that is valid on the key level which indicates impending counter trend (with the resistance level by rejecting the pin bar formed), we can take a position based on a sell signal that enough valid it is.

2. Example on AUD/JPY: inside bar/pin bar on conditions ranging (sideway)


The chart above AUD/JPY daily market conditions being sideway with resistance level at around 77.60 and support about 73.62. In August 2010 is formed inside the bar and bar/pin combinations inside the bar. As discussed in the previous topic, price action formation inside the bar indicates the market is this group, and in this case the forwarding happens trend (downtrend) after the next bar is formed. If we miss the moment, entry on on 23 August be formation inside the bar with a combination of pin bars that support the forwarding of the previous trend, and this is the sell signal which is quite valid for our open positions with the reward level (target) at level supportnya.

3. Example on AUD/USD: fakey bar, counter trend and pin bar
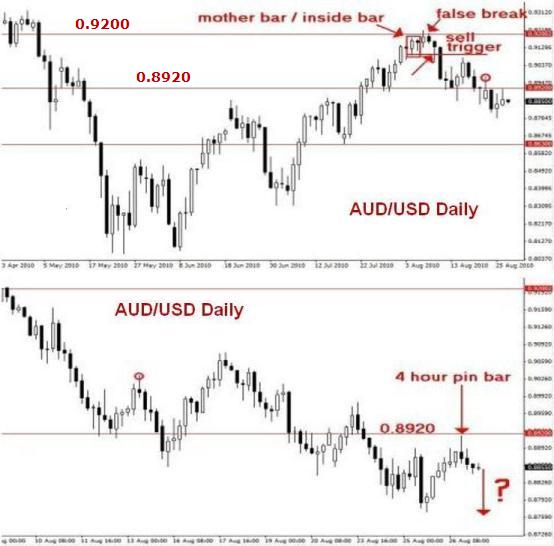
 

Similar to the previous example 1, price action on AUD/USD above also confirm the counter trend that will occur with the formation of fakey bar once inside the bar. Fakey rejecting bar at 0.9200 resistance level gave a sell signal with the target level on support at 0.8920.

Then on the 4-hour chart formed a pin bar unconfirmed clearly on the daily chart. If our assumptions on a 4-hour course, and rejecting the pin bar at 0.8920 support level, we could sell entry with reward (target) level that is not too large because of unconfirmed right with higher time frame (daily chart).

4. Example: NZD/USD pin bar that runs good and fail


In the example above there are 2 pin bar. The first (top) go according to the rules of price action after rejecting on its resistance level. Stop loss can be at a level slightly above the highest level pin bar, and if left open positions can still be entry level corrections bars 4-6 the next day during resistance level has not been impregnable.

The second pin bar (below) that is formed is an example of an indication of the price action that failed. If we open buy on the day afterwards with stop loss at the level of the lowest level under little pin bar, maybe the losses we are not too large.

Indeed not all lineups bar formed in the price action always goes well, that we still have to take care of is the risk/reward ratio in accordance with our plan. trading

5. Examples on the USD/CAD: pin bar that runs good and fail on ranging market


As with example 4, pin bar last (rightmost) on ranging USD/CAD daily chart above has failed to indicate a buy signal, at least if the stop loss level we are slightly below the lowest level the bar pin
 
6. Examples on the XAU/USD (Gold): pin bar that runs good and fail on ranging market 


The price action in gold (XAU/USD) at the time of the period such as the image above indicates the signals a valid trading supported by key resistance level in 1, 210.00. After rejecting occurred inside the bar on the level of the key we can sell with stop entry levels above the highest level inside the bar. Our buy position open after closing prices the day after the fakey setups candlestick bar broke through a key level, and we can average with a buy entry again after rejecting the pin bar (far right) at level a key support level now so

. If we see the price movements in the days that followed, the formations are formed inside the bar (lower picture) that allows forwarding trend up, and with the momentum bullish signal indicates a fairly strong buy


In conclusion, the formation of price action always happens almost every week on the price movement of several currencies and other commodities. Some of them are there really is less valid even fail to indicate signal trades. The more we often observed with careful analysis on a wide range of currencies and commodities will be the more accurate we determine the formation of a valid bar

Because not all lineups bar formed in the price action has always run smoothly, we should keep trading in accordance with the risk/reward ratio that we agree upon.
Read More

Saturday, September 24, 2016

rhein

Inspiration Forex (1) - Sun Tzu

The art of war Sun Tzu is a widely read classics and applied to various fields, because of the nature of the fundamental natural easily adapted in various areas of life. In this post, I extract some sections to be applied in trading and in doing so, hoping to introduce the concept of trading that are important to you.


I also classifies and categorizes them for easy understanding. To put it in context, I have the term outcome as follows:
-General = you/
trader-Trading
= Battle troops = capital/money You

in TERMS OF UNDERSTANDING the MARKET

"we are not fit to lead an army on the March unless we are familiar with the face of his country-the mountains and forests, traps and cliffs as well as swamps." (Sun Tzu).

Like what Warren Buffett puts it, "the risk of not knowing what you are doing. If you do not understand the market, you are not fit to invest in it. You will get your capital (soldiers) were swept out of stock "

" he who knows all this, and in fighting puts his knowledge into practice, will win the battle. " (Sun Tzu).

Not good enough if we only know the theories and concepts behind the investment. A trader should be able to apply that knowledge correctly to gain profit from the market.

In TERMS of PSYCHOLOGY TRADER

"a general, who was unable to control his annoyance, will launch his men to attack like ants swarming, resulted in one third of his men fall, while the city was still uncontrollably. Such is the ill effects of the siege. " (Sun Tzu)

Don't be emotionally affected by market or loss. If a trader is too eager to profit or revenge losses, traders can lose sanity and become irrational. Decisions that diabil likely to defect and ended up with a loss. Such is the ill effects of impulsive
trading
"there are five dangerous faults which may affect a General:
(1) faux pas, that leads to destruction,
(2) coward, which leads to being caught,
(3) hasty temperament, which can be triggered by humiliation,
(4) the enjoyment of honor which is sensitive to shame,
(5) over-attention on the troops, who took him on concerns and issues"

Psychology is the key to the trader. If he can't control his emotions and his character, he will lose money in the market. If he's sloppy, he will make a desperate trading without taking into account the opportunities to win. If he is a coward, he never could win big enough to cover the losses. If he has a temperament that is hasty, he will try to take revenge on the market that ended with losses. If she prides itself on when he wins, he will be calm when he lost and he'll never learn from mistakes. If he is over attention on the loss, he would always worry and can never make deals more with better.

In TERMS of MANAGEMENT of MONEY

"control/settings over a large army is the same principle as control over some people, it is just sebuahpertanyaan about the Division of their numbers." (Sun Tzu)

Trading big capital is the same is the case with small capital trading. You should not be affected by the absolute figures of losses and gains when trading. Follow the normal rules and system and divide the capital accord of the lot and the right position.

In TERMS of MOVING AWAY FROM MARKET

"he will win who knows when to fight and when not to fight." (Sun Tzu)

Opportunities are not always available in the market. There are times that your trading system would not work and it is important to be absent from the trading market. If you insist in the trading market in conditions like that, you'll end up in a series of losses and deplete your capital unnecessarily.

When you experience a series of losses, it is a sign of clear for you to stop trading. Contemplate whether it is a problem with myself, or a system that does not work under certain market conditions.

During live your reflection, stop all your trading activities until you find out the real problem. You will learn more about yourself, trading systems and market. This experience will help in assessing when to trade and when not to trade in the future. Do not fight not meaningless coward, it is the mantra of "survive to fight another day."

"If the battle is sure to produce a victory, then you must fight, even though rulers had forbidden it. If fighting will not result in victory, then you don't have to fight even when there is a supply of rulers. "

Important learning to trading when there is a favorable opportunity to do so. But more importantly learning not to trading when the situation is not favorable.
Read More
rhein

the KEY to confirm price action

This article discusses about some way of confirming setup price action formed in order to obtained a valid trading signals. Konfirmator commonly used is a level-level support and resistance, both in the form of a horizontal line as well as in the form of moving averages. Price action formation creations can be directly observed in chart trading, so too are the levels of the intended konfirmator. With the combination of price action and the level of support or resistance will be obtained with trading signals a high enough probability.

The stronger level of support or resistance the more valid trading signals are generated. Price action formed at approximately the level shows market sentiment is going on. To avoid any noise or errors that might happen we can use the time frame height (4-hour or daily), is to determine the proper entry momentum could use technical indicators as indicators of oscillator overbought level for knowing or oversold (RSI, stochastic, MACD), and indicator ADX trend strength to know is going on.

Confirmation of the price action on the conditions of the market trending

the following example setup price action that occurs on the level of support and resistance levels for the downtrend market conditions (the main trend) and corrections (the retracement).


Note the formation of bar formed at level-the level of support and resistance (a horizontal red line) that we can use to nenetapkan entry level after the formation of the bar is formed, and also the exit level of the target. Some pin bar formed experiencing rejection (rejection) by the level of resistance or support, and long tail bar pin formed close to a new support level.

Confirmation of the price action on the market condition sideways (ranging)

In a sideways market conditions (ranging), konfirmator is best to be on the level of support and resistance. This kind of market conditions can be seen through the indicator ADX and oscillator where the trend is happening is not strong enough.


It appears that the formation of the bar formed at the level of support and resistance (inside the bar and pin bar) is quite valid as signal entry. It's just for the market that is being consolidated like this we should be careful in determining the exit target must anticipate if the direction of price movement suddenly turned and turned into a trending. This is where the importance of the risk/reward ratio in the trading plan. When the support level has been impregnable with long tail pin bar formation, then the next two days the price fell sharply and market conditions become a downtrend. At the time it was formed and the pin bar support level to break down the actual conditions, ranging above is finished and changed into a downtrend.

Confirmation of the price action with moving averages as support and resistance Indicator

dynamic exponential moving average (ema) mainly ema8-daily ema21-daily and is often used as a confirmation of the price action that is occurring, especially in a trending market conditions. EMA forms a level-level of support or resistance.

In the example above setup price action which occurred near ema8-daily ema21 and daily-i.e. the pin bar and fakey bar can be used as a signal for the entry.
Read More
rhein

4 things About Price Action that needs to be Known

The State of the market is always changing over time, so too his volatility. A when the market price fluctuations can be very high with a large daily trading range, but at other times the market can barely moving quietly for a certain period of time. When volatility is low many traders who complained did nothing wrong with the price action. Even though they are trading with observed price action but may be less savvy about the price action itself. There is no wrong or right on price action, price action is only reflecting market reaction over the sentiment of the perpetrators.

1. Price action trading systems is not a
many traders consider the price action is a trading system that is rigid and should be run in accordance with certain rules. Price action is not a trading system that implements many technical indicators, but more into discretionary trading is more based on the experience and not too rely on technical indicators. So far there has been no trading software programmed based on price action.

In trading with observations of price action is not necessary calculations such as technical indicators but rather observations on market movements which change according to the sentiment of the market participants. Most professional traders use discretionary trading, which is certainly not escape the observation on price action.

2. Price action is universal and can always run
Most traders there who complained as "this time the method of price action is not running" or "maybe there is something wrong with the price his action". Trading based on observations of the price action has been used in Japan since the 18th century in order to predict price movement of rice along with starting the introduction of how to read market price movement with the candlestick. At that time there has not been one indikatorpun used, and up to now, 300 years later, candlestick and observations of price action is still used in trading

. Trading with price action is how to read candlestick patterns are natural, and this can always be applied as the sentiment of market participants will tend to repeat them are greed and fear (greedy and fear) that is always reflected in the pattern of price action.

3. Price action rather than just a row of bars
candlestick Price action is not just rows of candlestick bars with a certain formula-formula, but shows the overall market movement is driven by the sentiment of the market participants. The longer you observe market movements (or the higher time frame trading), then you will understand the market sentiment was further

. 4. the Necessary consistency and discipline to understand price action
Unlike the technical indicators which can be quickly understood, interpretation of price action takes time and experience. To understand the pattern of price movements which change according to the sentiment of the market you have to consistently practice and discipline.

Read More

Friday, September 23, 2016

rhein

TRICK & Level Key of Price Action

Level level key meant here is the level of support and resistance, both in the form of a horizontal line, static or dynamic form aluran line moving average. Fibonacci retracement level also includes key level because it shows
support and resistance. As it has never been reviewed on several articles before, trading with price action does not rely on technical indicators are complicated and complex but only on observation of the formation the formation of bar-bar at candlestick could be, fakey (false) the bar and inside the bar (the term in the price action). Supporting indicators are often used to confirm is the exponential moving average (ema), because the moving average shows the level of support/resistance

dynamic. In this article reviewed how the formation of price action formed at key levels will affect significantly to the direction of price movements, so that we can appropriately determine the points
entry. The following examples use the daily time frame, which is highly recommended for use when we are trading with price action.
method of
Price action and levels of support/resistance on trending market conditions


Note the formation of bar formed at level-the level of support and resistance (a horizontal red line) that surely we can use to nenetapkan level entry (after the formation of the bar was formed) and exit level target (line support/resistance).

Price action and levels of support/resistance on ranging market conditions (sideway)


It appears that the formation of the bar formed at the level of support and resistance (inside the bar and pin bar) is quite valid for our entry. It's just for the market that is being
or being
ranging group we should be careful in determining the exit target because we must anticipate if market conditions suddenly turned contrary to our entry positions and turned into strong trending. This is where the importance of the risk/reward ratio in trading

plan. When the support level has been impregnable with the formation of long tailed pin bar, then the next two days the price fell sharply and market conditions become a downtrend. At the time it was formed and the pin bar support level to break down the actual conditions, ranging above is finished and changed into a downtrend. We can sell entry on two the next day.

Price action and ' swing ' point on trending market conditions

When a price movement occurs at the points of the new highest or lowest, and then undergo a correction before returning to the original trend, the lowest price and the highest peak or Valley on the correction is called swing point. Swing point important to note because at those points will be established the levels of support or resistance. Swing point at that point in the Valley when the uptrend forming a new support level, and at the cusp point swing when the downtrend will form a new resistance level.

Look at the price action which occurred near at points swing point for example EUR/USD daily above. Swing point forming the level key (key level) the new support level, and confirmed the validitasnya on the bars in a row as the next resistance, support and resistance again. Price action that occurs is represented by two pin bar formed at the level of the key, and we can analyze its validity after the entry pin the bar correctly. In this case the key level is formed on the swing point becomes the second major factor supporting the bar pin .

Price action and the exponential moving average indicator on trending market conditions


An indicator of the exponential moving average (ema) mainly ema8 daily ema21 and daily is often used as a confirmation of the price action that is occurring, especially in a trending market conditions. The moving average formed a level of support or resistance. Look at the examples on the EUR/USD daily above, price action which occurred near ema8 and ema21 in trending market conditions (when an uptrend or downtrend), namely in the form of a pin bar and the bar pretty fakey valid for our entry guidelines.

Price action and event area on the level of support and resistance.
 

Event area yaitu area disekitar level support atau resistance yang tertembus (break) akibat event tertentu yang terjadi pada pergerakan harga pasar. Selanjutnya jika pergerakan harga tetap mengacu pada level support atau resistance tersebut, maka event area pada level itu akan sangat signifikan, dan price action yang terbentuk disekitarnya sangat penting untuk dicermati.
Pada contoh XAU/USD (spot gold) diatas, event area disekitar level 1,700.00 adalah sangat signifikan dimana price action yang terjadi dengan terbentuknya beberapa pin bar yang cukup valid untuk patokan entry.
Dari contoh-contoh diatas bisa disimpulkan bahwa price action yang terjadi pada suatu kondisi pasar dengan level-level kuncinya sebagai faktor pendukung utama, baik itu level support / resistance statis (garis horisontal) atau dinamis (exponential moving average), swing point ataupun event area, akan bisa menjadi pedoman yang cukup valid untuk entry market.


Read More

Thursday, September 22, 2016

rhein

Some TRICK trade with Price action


Many forex traders tend to try to analyze multiple variables at the same time, especially traders who do not yet have a specific strategy and methods to be applied in daily trading. Often they combine several technical indicators at once, see a few currency pairs in different time frames as well as the development of various news reading fundamentals. This way is clearly not effective. They intend to understand the movement of market prices with coverage that is too broad so confusing and tends to over-

analysis. This article related to the concept of ' specialisation ' in forex trading, where the method of price action is one part of it. Forex trader is a profession, and as with any other profession, specialization in General is always more profitable. Doctors commonly encountered and for the lucky income can be very good, but the more rare specialist of general practitioner course will earn better because they controlled the special fields that are not owned by general practitioners. A forex traders who have certain methods that have been tested are specialists in trading.

The advantage of the method of price action
the main advantage is price action trading method this method can be used with simple. We just need to focus on the pattern of market price movement for what it is as well as level-the level of support and resistance. Technical indicators are very minimal, usually only the moving average indicator for confirmation. The method of price action can be applied on all currency pairs and time frame trading used usually daily or 4-hour. If at one time frame have been formed within the formation setup price actionnya, then it should not be compared with the time frame larger or smaller. With the accustomed method using price action in the discipline in trading, the trader will no doubt when it was about to open a position because of the trading signals that are generated are usually quite valid.

Examples of the application of the method of price action Following the trading method is exemplified
with the price action on the EUR/JPY daily. You could develop a method of price action with your own strategy, especially in determining entry and exit points as well as risk/reward ratio. EUR/JPY is exemplified here because this currency pair is quite popular, liquid and can be predicted (predictable)
First is to determine market conditions, trending or ranging (sideways)
Having in mind the market conditions are currently uptrend, we then determine the level key support and resistance:
We use indicators of exponential moving average (ema) 8 and 21 ema as confirmation of the setup price action formed. As it known in the setup price action there is pin bars, fakey bar and inside the bar. In the chart of EUR/JPY setup fakey look of this bar by the refusal (rejection) of ema8 as a dynamic support level, and if the setup is correct (unconfirmed) price will move in the direction of the uptrend.

The main characteristics of the formation of the fakey bar consists of the inside bar, followed by a false break ' bar ' that is formed and closed at the level of the range inside the bar. The entry point for a buy position can be specified when the top level inside the bar is penetrated, being stop loss level set at a low level of formation fakey bar (the ' false break ').

Finally we set the risk/reward ratio. Can be 1:1 or 1:2 in accordance with the money management strategy which we have agreed. We can also maximize profit using trailing stop, averaging technique or pyramiding.


Read More
rhein

Level 1.1200 Resistant reinforcement of EURUSD

Forex World - EURUSD managed to post a monetary policy decision strengthened the Federal Reserve, but strengthening is seen still stuck level psychological 1.1200.

Transpiration and movement required consistently above the area to rise further to test area 1.1240. Opportunities to 1.1275 be open if EURUSD is able to penetrate 1.1240.

If you see a 4-hour stochastic indicator in the saturated, EURUSD buy can be rectified to 1.1170 area if it failed to penetrate the 1.1200 upwards. Further support if 1.1170 bypassed 1.1140. area is

Resistant: 1.1200, 1.1240, 1.1275
Support: 1.1170, 1.1140, 1.1020

Read More
rhein

GBPUSD Potential Rectified if it fails Skip 1.3060

Forex World - Although the dollar depressed due to the projected U.S. Federal Reserve interest rates, but the pair GBPUSD looks hard-pressed to continue strengthening

. The closest is dikisaran resistant 1.3060, if failed to penetrate the area potentially GBPUSD rectified to the psychological 1.3000 level given the indicator stockhastic in the saturation buy. Transpiration below 1.3000 would bring the price to 1.2940.

While if managed to penetrate the 1.3060, GBPUSD could rise to 1.3120 area, before aiming 1.3190 area if 1.3120 exceeded.

Resistant: 1.3060, 1.3120, 1.3190
Support: 1.3000, 1.2940, 1.2880

Read More
rhein

Learn about Price action

In the previous articles has been discussed a lot about the trading strategies with the price action and how to apply it in a variety of market conditions. For those who do not yet know the methods of price action at all, this time discussing the article on the basics of price action and why a trader should implement this method.


What is Price Action?

The financial market was the scene of the buying and selling exchange rates between market participants. Exchange rates it leave traces in the form of movement of prices or price action can be observed clearly on trading chart.

A trader will read, Digest and ultimately position opening trade followed the trail set up by price action. How trading like this is called trading with price action strategies or trading with price action setups.

In fact, traces of price movement formed by price action is always repeated on any market conditions. It is very closely related to the characteristics of the market participants, where the nature of the one will generally predictable when dealing with money. The action of the market participants are clearly reflected in the formation of the candlestick bars (if you used to use candlestick trading), rods or bars on a bar chart that form the pattern of movement of prices (price action) that are repeated periodically, so that the price action this can be used as a tool in trading to predict price movement with accurate.

Not only on the financial markets or forex market, price action strategies can be applied to any market because of the nature and characteristics of the perpetrator in the same market.

Trading with price action strategies can be applied on any time frame, but it is highly recommended to use the daily time frame considering the accuracy of the data and the resulting signals, in addition to this price action is also suitable and easily applied in the forex market as more trending patterns that occur continuously compared to other market.


Why Use Price Action?

Real easy to be answered, because the price (price) is the principal element is in the financial markets. As with a book, if you don't know how to read it, you will not know what the actual content or story presented in the book. If you don't know how to read the movement of prices (price action) in the market, then you will not be able to understand and Digest ' story ' price delivered market.

Final results from the combination of a variety of variable that is used to analyze or predict future market price movements is itself, therefore we recommend that a trader focuses on understanding price action and not on the parameters of a range of indicators as tools of prediction.

It is important to Note On the strategy of Price Action:

1. There are many different formations of the candlestick bar at might formed by the price action in different market conditions. He should learn to read and understand a formation before the formation of the others. After you understand how to implement in trading for a specific market conditions, just learning the other formations.

2. If you use the previous time frame under the daily (1 hour, 30 minute, 15 minute, etc.), start learning the trade with the daily time frame in order to avoid an error signal and the ' noise ' in the movement of prices, that would be very influential on the formation of the price action that is formed. Besides the smaller time frame you use, the more you tend to over-trade or frequent entry, and by the presence of noise and false signals or false (false signals) that often occur on the time frame is low, You likely wrong in predicting price movements.
If you are familiar with the daily time frame, start observing the formation of bar formed by price
action. 
3. Learn from traders who have successfully implemented a strategy of price action, or learning the ways of the implementation of the various application examples of price action trading.

One more thing, regardless of your current trading strategy, the application of the method of price action will not mess up your trading, and will add Your sharpness in predicting price movements of the market.
Read More
rhein

Trick Breakout Strategy on EURUSD

A market in which a pair of currencies move approaching new lows, can serve as opportunities for traders to trade on a breakout the next. In Forex trading, there are many different ways to approach a market like that. Below, we can see a great example, using the chart EURUSD daily.

In the following chart, looks clearly that market trends are moving down, and continue to fall to a lower point for two months, until eventually decline as many as 867 pips since February yesterday. For market conditions like these, one chance we can achieve, namely by implementing a strategy, known as the breakout strategy.


Breakout trading
Let's look back the chart EURUSD above, the condition of the strong downtrend on the chart have been identified, by this time also, the trader can begin planning a breakout trading, namely trading over the lowest position in the chart.

Well, first of all, we start by identifying low beforehand, i.e. at points around the range 1.2845. The low point of this is what is called the price floor, or point support which supports the movement of a currency pair. Keep in mind, in the breakout strategy, new market entry can be done, when the price moves below the low points we already identify. And after that, a new trader can do action, in hopes of selling, the price of EURUSD will continue to move down to a lower point again.

One of the easiest methods in trading a breakout is a method known as, entry order. Entry of this order is a great way to breakout trading, since you can select the appropriate prices, with who you want, at the time of entry into the market.

When pricing options you want available in such trading, then the order can be quickly executed. This can be a great benefit to traders who can not monitor the trading screen for 24 hours. In fact, if You're in a position of not being able to access any data online, but if you want pricing options available, then your transaction will be directly executed.


Setting Stop Loss
as with any trading plan in General, breakout traders also need to limit risks in the same way, namely by setting the point of stop orders. There are many ways to put a stop point, but one of the easiest ways is to set a stop order along the lowest high point in the chart.

A limit order can always be arranged by using the ratio of reward risk. Because, the duration trend alone could not have been predicted, traders can put the setting ratio in comparison with risk: reward is 1:2. It can be found by extrapolating the number of pips at stake after setting the stop order is applied.
Read More

Wednesday, September 21, 2016

rhein

The Strategy Of Utilizing Stop Loss Above Axis


As you can understand, the axis is the line length resulting from the price movement on a candlestick: If the initial price increase and eventually decline, then it will happen the line is referred to as the axis. And vice versa if the decline happens early opening, then it will eventually increase and the axis will disappear from the candle

. When you can understand the wick on a candle, then most likely the losses experienced by small, while the level will benefit will be greater. Another benefit of the wick on the candle is existence which was able to show the difference in the strength of the bidders or buyers.

If the bidder is stronger, the price tends to go against the previous movement. This occurs when one of the power supply and demand is different. Resulting in the position of one party is stronger than the other parties. For more details look at the daily chart of mari USD/JPY below:


The placement of Stop Loss on Candle
the above chart is the daily chart shows the pair USD/JPY is being located in a down-trend. The move raises the chances for short (sell). If you want to control your trading by using stop loss (SL), you just simply find the long axis on a candle and placing the order SL there. As seen in the example above, where there are 3 candle that has shown its

. A long axis above the candle brought about by buyers pushed prices higher and higher. Whereas, the long axis that appears and is left behind when the turn candle caused the buyer is not able to maintain the high movement while sellers have come up and push the price to a lower point.

Ideally, indicating that there has been a displacement by forming the price reversal is not because the buyer could not maintain the ride conditions. Finally the seller (bear) won during that time period. Because the price could not be pushed to the top of the axis, then the placement of stop order just above the axis is the most potential because of his difficult price approaching that area back.

But there are things to look out for when this has happened the axis. Although this is not absolutely happen, sometimes it will appear someday. For that you should be wary when a stop order already placed on the axis, and finally the axis will also be at the bottom of the candle. From there, you should get ready for closing the transaction so that Your benefits are not eroded by floating before Your stop orders are executed and out of trades.
Read More
rhein

Success And Duration Of Learning Forex Trading

There have been many people who learned all this time, still do not have enough income from forex. For many years the forex business that was seen by some of them is a promising business, it was not as beautiful as his promise. Many have failed, many are frustrated, and many are also the result of forex bankrupt. Almost no one is really successful from forex trading. Whether such existence? How long does it take to actually learn forex? Let's discuss more on this article.


Viewed from an existing friends on forums, websites, facebook group, still many who complain are exposed Margin Call when he said was already involved with trading of 4. Some say since decades ago know forex, but until now not filthy rich. Could it be successful trading forex is a pseudo?

He said, when it's working in a business so long, then it would be shrewd against such activities. Suppose the learning nyetir the car, if the beginning of the study certainly fear tuh could not start the car. So can run, little by little and even nubruk people. Yet to be, it fell into the ditch. Forget the brake ketenggor rambutan tree Stampede, cars already ancur-ancuran still forfeiture were violating the rules. When already adept at speeding and inconsiderate, because the fate of the pesky car remove tire on the road, eventually just tetep battered nyungsep at the Office police force. Well, his name was also just learning


. Long Time Learning Forex is not no effect

there are a few different things in the forex. Research proves people who succeed in the forex business has nothing to do against someone who has experience of working in this business a long time. It could be just those who already trade many years still keep learning until now, but never tried to improve himself from the mistakes that have been made. Finally, they are just turning on a vicious circle where he will again do the same mistakes in their transactions.

Never encountered people who are already plunging long in forex. A dozen years he has studied the trading. It turns out he did buy and sell transactions based on feeling and absolutely no heed to money management. Open positions based on the past experience of the course. What happens next? He never managed to raise profits and multiply the profit results already obtained. Fortunately there are other income, so this senior trader can injection of funds when the trading losses, and until now he has been many times do depo since MC.


Holding the principle of

the most important thing for you is to always remember that there are still many unknowns from forex. There are still many who have not been able to understand the market. Therefore, let us not be easy so arrogant.

Don't be surprised if you see a newbie smarter, more powerful, and more successful than us. Because maybe the newbie is already capable of obeying the rules and not repeat the same mistake on the outcome of this transaction. So in fact actually much can we learn from a newbie that really diligent and seriously Learn forex trading


. Conclusion

Learn forex trading could not be equated with people learning all this time in the real world. To be successful at forex, you don't take time to linger, just follow the rules. And don't repeat the mistakes you'll ever do. If you can afford to be successful today, why should You delay by repeating the same mistakes? Successful trading is real when you already understand the forex trading itself.
Read More
rhein

Learn To Become A Successful Forex Trader

After observing in the last few months since becoming a trader, it still contained the behaviour of a trader who has mistaken perceptions about the world of trading. For a trader's new foray into the world of trading, sometimes they looked at that world of trading is a way in which to get rich instantly, then plunge it into the base without having enough. In fact, this is incorrect.
You need to remember, Trading is not a slot machine that easily insert a coin. In addition, trading also is not a game where you just press a key BUY or SELL. Actual trading is a form of investment. Where the investment such as embed your money to get a "return of investment" to several percent per year. However, along with the possibility of profit, there is also the possibility of loss. The magnitude of profit to be had no matter is different for everyone, so we must continue to learn in order to become a successful trader.

There is a very interesting story of a trader subjected one forums I have ever read, that trader is about his experience during be a trader.

"When I became a trader at one of the firms on Wall Street, where there is one person that always produces profit more from all of us at the firm. We all are very shy and amazed him. Never a time we saw him produce half a million U.s. dollars in just one day and I still remember clearly with the events on that day. We all gather around their computers and listening to what he tradingkan. We all hope will get enlightenment to be like him. "

" He was very good until I was nervous if it speaks to him. He's like a celebrity. But after a year of trading with him, in one room, I could not find how he did it. It's like something magical. "

" A few years later, I found my own trading success. It's just that, I have not really sure. It seems to be bigger than this. I think this is related to the market that is always dynamic, and I still continue to learn today. "

Note: for an experienced traders, though, they are still required to continue to always learn.

The trading world is a dynamic world, various aspects incorporated in it. If we want to become a trader that is really successful, then we should always learn to understand it. Without learning then we will not have a base in the conquered world of trading which is considered by some as a "Welcome to the Jungle". Plunge into the world of trading without having sufficient willingness to keep learning, tantamount to get lost amongst the wilderness where you can all at any time
Read More

Tuesday, September 20, 2016

rhein

5 basic principles of ANALYZING part 3


The FOURTH PRINCIPLE 
the dominance of Transactions one of the market participants will be Weakened because of two things, first: When one of the market participants are not able to Accept a price Above the highest price or the lowest Price Below happened.
Second: When The Volume Of Transactions Made Market Participants In The Currency Market In Numbers Little Or Small.
And small or at least the Volume of transactions that occur Is Likely Only to be caused by two things, namely, the first probably because market participants active in the currency market When it does a little bit and in the second it is possible that an active market participants it was a lot but they don't Transact due to waiting for the right moment to Transact in the currency markets 
 

As we already understand based on the behavior of market participants or the laws of the equilibrium of the market then we know that generally it can be said that the actual price that moving from an area agreement to the deal that formed before or moves to form a new deal area. Agreement area is the area of price or price range where the price moves back and forth along the range or area within a specific period of time. If seen from the viewpoint of the behavior of market participants then this agreement area is the area of the exchange rate (price) where market participants either acting as Sellers or Buyers feel comfortable to Transact in the currency exchange rate area because the price (exchange rate) are within limits (range) which they can receive interest or otherwise market to Transact in the area of his interests is very high. Technically the area agreement (Consensus) we can easily identify the data on price movements. The more often a level pass rates of price movement then we know that the transaction is also often done at such price levels, meaning that it can be said that market participants liked to Transact at these price levels. Conversely, if a price level is less traveled price movement then we know that the transaction is rare or little done in the price level, meaning that it can be said that market participants do not like to Transact at these price levels.

The price will move out of the Area or areas Forming the deal when an inefficient provision of interest on one of the market participants, so if the Buyers interest increased and greater than the interests of the Sellers then Buyers are likely to be seen more often Transact so prices will continue to accumulate increased and vice versa if the Sellers interest increased and greater than the interest of the Buyers then the Sellers tend to be more often Transact so prices will accumulate on the decline. Well, when interest in one of the market participants continue to rise and the interest of other market participants is dropping or not able to compensate for those transactions conducted his interest in the market then prices will continue to accumulate in one direction. The accumulated price movements in this direction if one is able to bring the price out of the previous Agreement Area then this is an indication that one of the market participants tend to bring out the price of the deal currently visible Area. If this State continues to take place followed by accumulation of these transactions continue to bring prices move to one direction and price finally completely out of the Area of the old Agreement then market participants that bring the price moves to one in this direction we say dominating the transactions that occurred at this time.

Well, when one market dominate those transactions that occur in the market then the market dominance will likely continue to persist until either one of the few things that are very clearly spelled out in the fourth Principle above happens in the market. For example at the time of the transactions that occurred in the market in domination by the Buyers then the price will continue to accumulate moving up form the price continues to be higher than before.

The process of accumulation of the movement of this ride will be stalled while Sellers can no longer accept exchange rate (price) above the highest price that was formed and this will be followed by a State growing volume (value) and the intensity of the Sell transactions undertaken the Sellers. When the volume (value) and the intensity of the Sell transaction increases then the accumulation of transactions that had dominated the Buy transaction will experience a decline in its dominance. If the interests of the Sellers continue to rise then it will happen some kind of effort on the Sellers to counterbalance the dominance of transactions carried out with the aim of suppressing Buyers prices are on a range of areas that favored Sellers of course. In this State if the interest of the Buyers remained high to bring the price even higher then it will happen some kind of resistance from Buyers which is causing the price looks on a certain range under the exchange rate (price) that formed when the Buyers still dominate in full. Attempts to compensate for the domination of the Buyers who do the sellers here's what if we observe in the data Area will be formed as the price Agreement (consensus).

The domination of Buyers as the example above will also be halted if the volume (value) and the intensity of the transaction Buyers begin to weakens or shrinking. Weakened or sags volume (value) and the intensity of the Buyers is only caused by two things that may happen in the market, namely: first because of the time the active market participants to transaction is completed (market Closed) or almost finished second and the market participants lose activity of this transaction because it is waiting for something fundamentally is directly related to the tendency of the direction of movement of currency exchange rates. When this situation occurs and the interests of the Sellers are also still small then the price data will be seen moving within a narrow range relative during a certain time. This situation is often found when the market approached the London or New York time Closed his data on price movements. As an analyst of our task one is having the ability to identify things that are mentioned above.

The FIFTH PRINCIPLE 
the dominance of the transaction and the weakening of the dominance of transactions that occur In the accumulation formed two Conditions of price movement that is Trending Conditions and conditions of Sideway. The second condition is Technically can be seen by observing the shape of Data distribution that is formed, either Visually Or Using the principles of measurement. 


Those transactions conducted market participants in the Forex Market is the main cause of the formation of price movement. Well, if the price (exchange rate) that occurs in a specific unit of time arrange by then susunanya will show and describe to us the changes that occur at a price over a specific time. As we already understand the formation of a price or exchange rate occurs because of the transaction in the currency market, and the transaction was carried out by market participants with specific reasons when market participants decided to commit the transaction. Whatever the reason the perpetrators of those markets when conducting a transaction then we as analysts could never figure out exactly what are the reasons that melatar-belakangi every decision taken the market participants. We can only observe what decisions they take based on observation of the changes of price data is going. Well, from here we can pull of any reasons that the correlation of market participants when they conduct transactions then the reasons directly related to their yg take decisions, namely the type of transactions that they do and the types of transactions what they do can we see from changes in exchange rates (prices) going on. The conclusion would mean that any reason market makers will be directly reflected in the price change itself.

The market participants outnumbered and we never know how exactly the amount and it also means there are very many reasons that would melatar-belakangi the decisions transactions carried out the perpetrators of this market. The good news no matter how much the number of market participants that are active transaction and no matter how many reasons melatar-belakangi their decision then the decision deals that eventually they do there are only two choices, i.e. transaction Buy or transaction Sellâ € ™. And since there are only two types of transaction that may be conducted at market price changes (exchange rate) is also just cause two things, namely the exchange rate (price) into a higher or lower being. Well, technically the rise and fall of this exchange rate if in stacking from time to time will form the order of price data based on time. Order this price data will show changes in the currency exchange rates (prices) from time to time if observed and classified this exchange rate changes then are accumulated only shows two patterns of movements of currency exchange rate changes. 

The pattern of movement of the exchange rate of the currency was the accumulation of exchange rate changes occur on an ongoing basis from time to time in the same direction in a time of relative length, meaning that price data from changes in exchange rates (prices), if the changes are rising then we will see the exchange rate continues to come up from time to time and vice versa, if the changes are down then we will see the exchange rate continues to decline over time. The pattern of movement of the exchange rate of the currency of the latter is the accumulation of changes in exchange rates (prices) going on in one direction within a relative short and then followed the accumulation of changes in exchange rates in the opposite direction in a relative short also, meaning that price data from changes in exchange rates (price) changes will be seen first on one direction within a relative short and then the exchange rate (the price of) these changes move back with the opposite direction from the direction of the previous changes are also occur in a relatively short.

To make it easy for analysts often use the term for the second movement of the accumulation patterns of changes in exchange rates (price) as a Trending pattern and the pattern of Sideway. Trending patterns is the pattern of accumulation of the movement of the exchange rate (price) that occurs in one direction in a relatively long, and the pattern is the pattern of accumulation of Sideway movement of the exchange rate (price) that occurs in two directions by turns in a relative short time. From research analysts also viewed that the second movement of the accumulation patterns of changes in exchange rates (prices) this always happen alternately systematically, so when the accumulation of the movement of the exchange rate of the current pattern is Trending then it can make sure that the next pattern is Sideway and so if the current pattern is Sideway then next pattern will happen is Trending patterns.

How long is the occurrence of phase patterns or patterns of Trending Sideway takes place on price movements until today is still an unsolved mystery. Long and short time of the ongoing phase of Trending patterns or technically Sideway pattern phase is directly related to the interest of the market participants are up to now still have not clearly measurable. From the time it is known that during the observation phase pattern Trending tend to look shorter than the time the phase pattern Sideway, while the range of price movements on a Trending pattern can already ascertained will always be larger than the range of price movements on a Sideway pattern. Well, a deep understanding of the pattern of Trending and Sideway patterns that occur on price movements will really help us as analysts to find out the trend of movements such as what is happening at the moment. Why? Because as we know the behavior of market participants in the Trending patterns and pattern Sideway very different and this difference is of course will make the strategies used in making the decisions of the transactions to be performed on each pattern is also different.
Read More
rhein

5 basic principles of ANALYZING part 2


 The THIRD PRINCIPLE of the
Where the trend direction of price movement Depends entirely on the accumulation of transactions Dominated by the time market participants Transact in the currency markets

we never know where and to where the price will move as we say in the first principle, but we can surmise where the direction of the current price trend will move by looking at or observing his movements based on what's happened before. Alleged or estimates where the trend direction of price movement is often used many analysts actually obtained by using some reference or benchmark for mendefenisikan tendency of the direction of price movements at this time. Any benchmark used to determine the direction of the current trend is true for these benchmark logically acceptable and have the background that have a compelling reason to be used as a benchmark. Well, as analysts we should choose to benchmark what we will use to determine the direction of the trend of price movements at the moment and as an analyst of course we will choose a benchmark that has a high degree of accuracy and are sensitive to change and reflects the trend direction is really happening on the current price with a high probability of

. A method or technique to determine the direction of the trend of price movements that developed and used today are always uses a number of previous good price data in large quantities or less as a base material for mendefenisikan tendency of price direction. This means that technically to specify the direction of the current price trend analysts actually just comparing current prices against the previous price data and then create a defenisi trend direction of current price based on certain criteria that is used on a method or technique used. So want to use methods of wave, candlestick, support-resistance, supply-demands, price action, statistics and so on then we know that the methods using the data of previous prices as reference. Well, simply put then I can say that for mendefenisikan tendency of the direction of price movement that today is rise or fall of any methods or techniques used are actually done by simply comparing the current price of a certain price in the previous period. And from here we can also understand and acknowledge that when differences of opinion occur between one analyst and other analysts about the tendency of the current price movement direction likely due to differences in the use of the methods and data reference used in the analysis.

As analysts our job like I tell above is determine the method that has a high degree of accuracy, sensitive to change and able to represent the condition of the trend of price movements that occur when this was real so that we get the right information or almost close to a reality that is happening on the price. From what we already understand then that matter where the price trend will move the current majority depends entirely on the type of transactions made market participants today, meaning if the current majority of market participants Transact Sell then of course the current tendency of prices to move down is greater. And vice versa if the majority of market participants currently Transact Buy then of course the tendency of prices to move up is greater. Well, based on this simple understanding can we conclude that to know the majority of these types of transactions do market participants as already mentioned in the second Principle then we need a starting point (the Starting Point) measurements to calculate or figure out what transaction that dominate the market (the majority) is currently based on the accumulation of those transactions that occur.

As we know the market is not always doing the same types of transactions, while it may be only one market participants Transact Sell and moments later there was another market participants Transact Buyâ € ™. While market participants Transact Sell then the prices will move down and by the time market participants Transact Buy then the price will move up. Well, the say it like the example above, suppose the starting price was worth then because there are transactions in the Sell rating (volume) that cause the price down 2 points so the price into 3 value. Then lets say 10 seconds then there are market participants who Transact Buy in volume in particular that cause the price up 10 points so price is changed to 13 in value then the meaning within 10 seconds if we see from the initial price value i.e. 5 means going rise 8 points because the price 10 seconds later to 13 value.
 

Well, in reality those transactions conducted the perpetrators of this market could at any time as it is already delivered on the first principle and how much volume is (yet) a transaction they will lakukanpun we never know. We can only know those transactions that occur after the market makers do it and where the trend direction change of the price (exchange rate) that occurs depends entirely on accumulated volume (the value of) transactions carried out the market participants. If the measurement is done from a certain time prior to the current volume (value) Buy transaction is greater than the volume (the value) of transaction Sell then we will automatically see a price (exchange rate) moves up from the initial exchange rate and vice versa. From this understanding we can deduce that the accumulated volume (the value of) those transactions conducted market participants is directly proportional to the magnitude of the change in the price, meaning the accumulated volume (the value of) those transactions happened we can calculate by observing changes in the the price itself actually

. It is this understanding through later analysts develop a variety of methods to be able to figure out the direction of the trend of price movements to help them in selecting a transaction decision what should they do when transacting in the currency market. An awful lot of background theory or concept of methods developed to know this price movement direction tendencies such as statistics, trigonometry, the correlation between variables are variables that affect the price movement, the behavior of market participants, or some combination of the fundamental theories and concepts. Whatever the background of the theory or concept used by analysts to develop metodanya all have the same goal, namely to know the tendencies of the current price movement direction. The difference of each method is technically will be visible at the level of accuracy and speed of such methods in translating the information that the analyst is required in analyzing and making decisions. And the difference in the level of accuracy and speed of a method in translating information by no means reflects the good or bad of a method, since it is entirely depending on how accurate and how fast the analyst requires information that it needs. To put it simply a trader with type scalper and type long term will require a level of accuracy and speed that is different from the information that they need.
 
Read More
rhein

5 basic principles of ANALYZING part 1


All the ' basics ' of understanding required in analyzing price movements will be spelled out in a clear ' 5 in the basic principles of Analyzing '. And if observed carefully, honest and open mind then what we will learn is real is not the analysis of legume or "indicator minded" as many other analyst-analyst Malays who somehow is so opposed to the way that we use in analyzing price movements. Analysis we learn here the base is based on the behavior of market participants that arrogant if I may I dare say this much higher does it weigh, elite class, smart than just the name ' Price Action '. The focus of our analysis point of severity is on movements that occur in prices, the idiots language is intent this is our eye when observing and analyzing the chart first seen yg it is price data (candlestick) good that currently or previously. From price data we see that then we translate that occurs at the prices based on nothing that we understand in 5 principles below so that we get a conclusion about everything that was going on at the current price. After that, then we compare what we already conclude that with the tools-tools (indicators) that we (want) to use to assure the conclusion that we have to get before we make a decision. hehehehe Happy learning.

The FIRST PRINCIPLE
does anyone know Where And To where the exchange rate of A currency pair will move

This principle must be strictly held by each analyst to evoke and engender realization that where currency exchange rates will move after the moment is a lack of uncertainty. The lack of this uncertainty arises because of the large number of parameters that affect or cause the onset of movement of the exchange rate of a currency pair, there is a parameter that has yet to be determined exactly . Analysts mendefenisikan parameters that do not have any interest in this as a measure of market participants that are active transactions at the time. Interest in the market which plays a very important role in influencing decisions made by each market participants when transacting in the currency market (Forex Market). The difficulty analysts to gauge interest in this as something that is the exact cause of the rise of the interest due on any market participants turned out to be extremely varied, or in other words an awful lot of things that can be the cause of the emergence of interest at every market. And the worse again is also known that interest in any market participants turned out to be changed and appear at any time. Its influence on price movement this means that prices can move on to one direction or can just suddenly stop or directly reverses direction without any warning or without any sign of anything that we can to anticipate the movement detection.

Well, with the awareness that no one knows where and to which the exchange rate of a currency pair will move after this time then we as analysts will be forced to always prepare all risks that might arise from any decision we take when transacting in the Forex Market. Every experienced analysts are always preparing for two scenarios in each decision taken after doing the analysis and withdrawal of the conclusion. The first scenario is a scenario that will be executed and the second scenario is a scenario that will be executed only if the first scenario does not work as the analysis and withdrawal of the conclusions that he has done.
 

 The SECOND PRINCIPLE of
prices move due to transactions carried out market participants


prices move causes only one IE because of currency transactions conducted market participants. In other words, it could be said that if there is no currency transactions conducted market participants then the exchange rate or the price will never change from the original exchange value. By understanding this principle we realise that the presence or existence of market participants in the Forex Market is directly related to the changes that occur at a price, because only with the existence of the market participants in the Forex Market was then the transaction-transaction currency allows it to happen. So if the price moves or changing its value then we know that the market participants there are in the market at that time. Well, from here we can understand why prices are seen moving very active and moving in a wide-range when some of the Forex Market is open at the same time, because of course an active market participants become more numerous in number when two or more open market in the same time. Well, as analysts we should know when a market is open and when a market is closed and at the market where many market participants are to help the effectiveness of strategies that we develop from the analysis we did.

Knowing when a Forex Market it is open or closed will help us to see the trend of transactions carried out market participants in each Market Session. This information is very important but often many novice analysts ignored it. But by observing the movement of prices happened to value price Open (opening price) in each Market Session we can directly find out where the trend direction of price movements that occur at this time. To put it simply, we know that right tendencies of the direction of price movements that rise if prices tend to play over the opening of a Market price value of Session and we know that the tendency of the direction of price movement it down if prices are likely to be played under the opening price of a Market value of Session. The value of Open or opening price in each Market Session is like a value starting price (starting price) before the transaction-transactions made market participants the next Session in the Market. So in other words where market participants in each Market that will bring the price Session we can see by comparing the price formed the current price when the Market value of the Session open.
  

Read More
rhein

Technical trading by John Murphy (3)

 
After we identify trends and determine the level of support and resistance (part 2), then we need to know the indicators that show the impending change in the direction of the trend and the strength of a trend.

6. Follow the direction of the moving average line
is actually a good indicator moving average method using simple (sma) or exponential (ema) provides trading signals that objectively, it's just their nature always late (lagging). This indicator does not predict the direction of the trend further, only hints at the State of the current trends are up (uptrend) or down (downtrend). Traders often get stuck when the market is sideway (ranging), therefore it is recommended to see the direction of the trend on higher time frame as a reference the main trend.

Moving average also act as support or resistance level. A popular way to learn trading signals is to use a combination of two moving averages with different periods. Trading signals occurs if a line of smaller cutting period (cross) line period. By following the direction of the moving average line we are trading in accordance with the direction of the trend (trend follower).


Some combinations of moving average that is popular among others: sma4 and 9 daily, sma9 and 18 daily, sma5 and 20 daily, sma8 and 21 daily, sma40 and 100 daily and sma144 and 200 daily.

7. Know when a reversal of the direction of price movement
If the moving average trend hints at this time, the indicator shows overbought state oscillator (saturated buy) and oversold (saturated selling) that suggests a reversal of the direction of price movements as trading signals. The State is a signal to sell overbought and oversold is a signal to buy. Two indicators of a hugely popular oscillator is the Relative Strength Index (RSI) and stochastics. Both are measured in a scale of 0-100%. Overbought/oversold state occurs at level 70/30 for RSI and stochastics for 80/20. The recommended period is 14 to RSI and 9 or 14 for stochastics.

In addition to overbought/oversold, the divergence that occurred on the indicator and price direction movement of the oscillator is also popular as a signal the reversal of the direction of motion of the price. Fairly accurate oscillator indicators be used on sideway market conditions. Signal on the weekly chart (weekly) can be used as a filter to chart daily, and the daily chart signals as filters to lower time frame.

8. Know the indications change trend Indicator
Moving Average Convergence Divergence (MACD) is a combination of two interlocking cross moving average with the overbought/oversold elements of an oscillator. In addition to the circumstances the way overbought/oversold reading almost the same indicators, MACD oscillator also indicate impending trend change when line trigger (trigger line) crossing with MACD line (MACD line). A popular way to know an indication of a change of trend is by looking at the histogram MACD divergence with the onset of price movement.

9. Know the strength (strength)
trend Indicators are used to measure the strength of the trend generally was Average Directional Movement Index (ADX). The ADX line moving up shows a strong trend, and vice versa when moving down shows the trend is being weakened. A strong trend occurs when ADX (blue) between the level of 25-65. Above level 70 usually indicates a State of saturated and will soon trend reverses direction. The right time to open buy/sell when + DI (color green) cross-on (red) from the bottom/top (see pictures below).


10. Know the direction of the trend of the magnitude of the volume of trade (for the stock market and futures)
in the stock market (and also stock index) and futures, an indicator of volume and open interest is very important to know and confirm the trend of price movement direction of the market right now. In both types of market indicators the volume always precedes price movement (leading indicator). The higher the volume then the stronger trend of the market. The higher open interest indicator also shows the trend grew stronger, but when open interest began to fall then shows the trend will saturate and will be reversible. Because the forex market is not centered on one of the Exchange as well as stock market, or decentralized, then the overall volume for trade statistics are not available so we could not measure the strength of the trend based on trading volume and open interest.

That's the essence of the content of the popular book titled ' Ten Laws of Technical Trading ' or ' Ten Technical Trading Rules in the ' written by John Murphy.
Read More